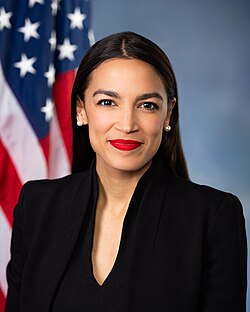
 Ocasio-CortezAOC41.2
43.7Vance
2028 presidential race
National primary averages for both parties, betting-market odds and early general-election matchups. No major candidate has declared, so the polls mostly measure name recognition.
Updated Nov. 7, 2026
Poll averages from COYNTOSS. Kalshi columns are traders’ prices as of Nov. 7, 2026, not a COYNTOSS forecast.

| Candidate | Bar | Polls | 30-day | Kalshi |
|---|---|---|---|---|
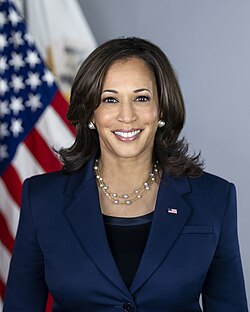
| Kamala Harris | 27.3% | +0.2 | 6% | |
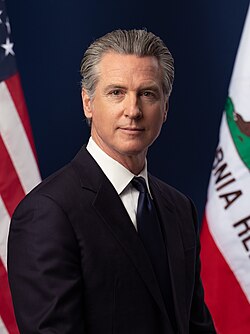 Gavin Newsom | 15.9% | 0.0 | 12% | |
 Pete Buttigieg | 10.8% | −0.3 | 5% | |
| Alexandria Ocasio-Cortez | 8.2% | −0.7 | 14% | |
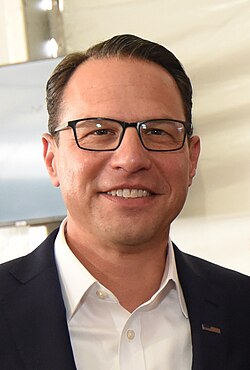 Josh Shapiro | 5.7% | +0.1 | 4% | |
 Mark Kelly | 5.2% | −0.1 | 4% | |
| Jon Ossoff | 5.2% | +0.1 | 24% | |
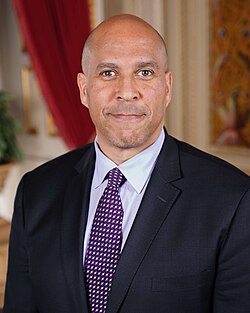 Cory Booker | 3.7% | 0.0 | 1% | |
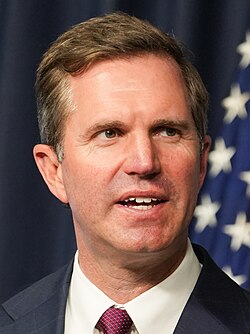 Andy Beshear | 3.3% | 4% | ||
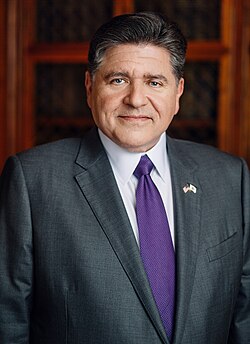 JB Pritzker | 3.1% | — | ||
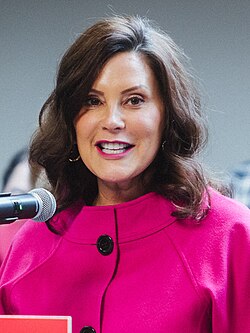 Gretchen Whitmer | 2.3% | 1% | ||
 Chris Murphy | 1.7% | <1% |
| Candidate | Bar | Polls | 30-day | Kalshi |
|---|---|---|---|---|
| JD Vance | 38.3% | +0.1 | 34% | |
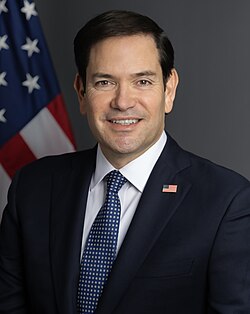 Marco Rubio | 17.3% | −0.3 | 20% | |
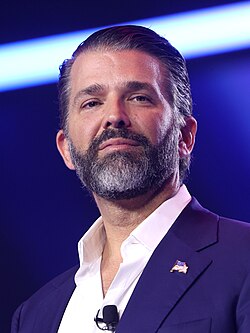 Donald Trump Jr. | 13.5% | +0.6 | — | |
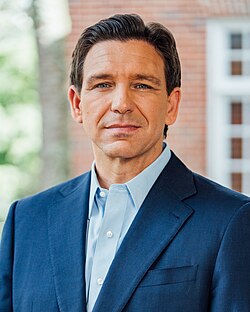 Ron DeSantis | 7.6% | 0.0 | 18% | |
 Robert F. Kennedy Jr. | 5.6% | +0.1 | <1% | |
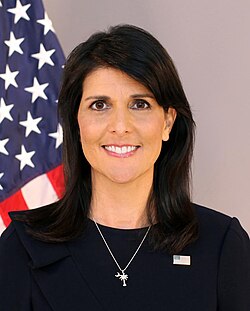 Nikki Haley | 4.6% | +0.1 | 1% | |
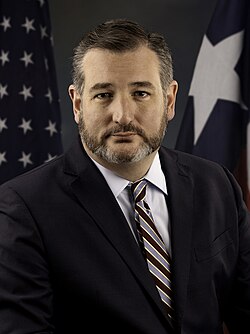 Ted Cruz | 3.5% | +0.1 | 2% | |
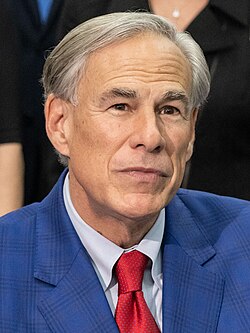 Greg Abbott | 2.6% | +0.2 | <1% | |
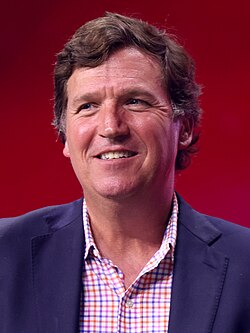 Tucker Carlson | 2.5% | 4% | ||
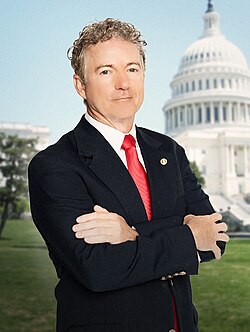 Rand Paul | 2.2% | 1% | ||
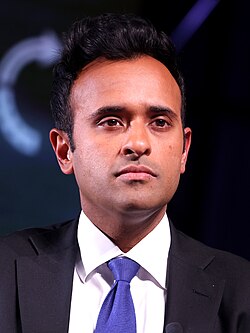 Vivek Ramaswamy | 2.2% | <1% | ||
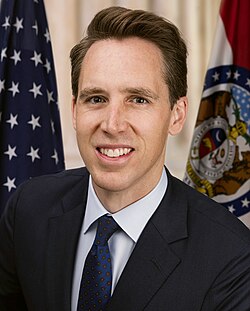 Josh Hawley | 1.7% | 1% |
Daily COYNTOSS averages for the six candidates polled most often in each party.
Average of 13 national polls · latest ended Sept. 15
| Poll | Date | Sample | MoE | Harris | Newsom | Buttigieg | Ocasio-Cortez | Shapiro | Kelly | Ossoff | Booker |
|---|---|---|---|---|---|---|---|---|---|---|---|
| COYNTOSS average | As of Nov. 7 | 27.3% | 15.9% | 10.8% | 8.2% | 5.7% | 5.2% | 5.2% | 3.7% | ||
| Big Data Poll for Public Polling Project | Sept. 13–15 | 1,329 LV | ±2.7 | 26.7% | 16.1% | 10.3% | 5.5% | 5.4% | 6.4% | ||
| Noble Predictive Insights for The Center Square | Aug. 12–16 | 930 RV | ±3.2 | 28% | 14% | 12% | 7% | 5% | 5% | 3% | |
| Echelon Insights | June 11–14 | 467 LV | ±4.5 | 20% | 14% | 14% | 12% | 6% | 4% | 2% | 3% |
| Noble Predictive Insights for The Center Square | June 1–4 | 1,224 RV | ±2.8 | 27% | 14% | 11% | 8% | ||||
| Focaldata for Financial Times | May 29–June 1 | 646 LV | ±3.9 | 37% | 17% | 8% | 7% | 3% | 5% | 2% | |
| HarrisX/Harris for Harvard CAPS | May 29–31 | RV | — | 44% | 26% | 8% | 10% | ||||
| TIPP Insights for Issues & Insights | May 26–28 | 593 RV | ±4.0 | 31% | 14% | 6% | 5% | 6% | 4% | 1% | 4% |
| Big Data Poll for Public Polling Project | May 24–27 | 1,378 LV | ±2.6 | 28% | 17% | 11% | 9% | 6% | 6% | 2% | |
| Emerson College | May 24–25 | 432 LV | ±4.7 | 9.9% | 15.9% | 17.9% | 11.1% | 10% | |||
| Overton Insights | May 16–20 | LV | — | 9% | 13% | 16% | 12% | 8% | 4% | 7% | |
| McLaughlin & Associates | May 12–18 | 459 LV | ±4.6 | 28% | 16% | 9% | 7% | 6% | 5% | ||
| Echelon Insights | May 14–18 | 501 LV | ±4.4 | 23% | 17% | 10% | 11% | 5% | 6% | 1% | 3% |
| Lord Ashcroft Polls | April 28–May 17 | 4,203 A | ±1.5 | 33% | 17% | 9% | 9% | 5% | 6% | 4% | |
| Lake Research Partners for FairVote | May 6–11 | 800 LV | ±3.5 | 25% | 17% | 15% | 9% | 6% | 8% | 5% | |
| AtlasIntel | May 4–7 | A | — | 13% | 21% | 22% | 26% | 2% | 4% | ||
| Focaldata for Financial Times | May 1–5 | 1,339 RV | ±2.7 | 38% | 16.2% | 8.9% | 8.5% | 5.1% | 5.6% | 1.5% | |
| HarrisX/Harris for Harvard CAPS | April 23–26 | RV | — | 50% | 22% | 8% | 9% | ||||
| Verasight | April 21–23 | 864 A | ±3.3 | 22% | 15% | 12% | 13% | 4% | 6% | 4% | |
| Echelon Insights | April 17–20 | 467 LV | ±4.5 | 22% | 21% | 12% | 10% | 5% | 3% | 2% | 4% |
| McLaughlin & Associates | April 8–15 | 457 LV | ±4.6 | 29% | 15% | 10% | 4% | 4% | 4% | ||
| YouGov | April 8–13 | 968 A | ±3.1 | 24% | 12% | 9% | 9% | 4% | 5% | 2% | |
| HarrisX/Harris for Harvard CAPS | March 25–26 | RV | — | 41% | 26% | 8% | 10% | ||||
| Yale Youth Poll | March 9–23 | 1,765 RV | ±2.3 | 20% | 19% | 14% | 13% | 4% | 7% | 1% | 2% |
| Echelon Insights | March 12–16 | 475 LV | ±4.5 | 21% | 19% | 9% | 11% | 5% | 4% | 1% | 4% |
| Focaldata | March 6–10 | 672 RV | ±3.8 | 39% | 22% | 8% | 11% | 6% | 4% | 2% | |
| McLaughlin & Associates | March 4–9 | 456 LV | ±4.6 | 20% | 19% | 9% | 11% | 5% | 2% | ||
| Noble Predictive Insights for The Center Square | March 2–5 | 1,152 RV | ±2.9 | 31% | 16% | 7% | 6% | 5% | 4% | 3% | |
| The Public Sentiment Institute | Feb. 28 | 124 LV | ±8.8 | 15% | 29% | 9% | 6% | 7% | 5% | ||
| Rasmussen Reports | Jan. 25–Feb. 27 | 1,155 LV | ±2.9 | 34% | 20% | 10% | 7% | 10% | 6% | ||
| J.L. Partners for DailyMail.com | Feb. 25–27 | 578 LV | ±4.1 | 23% | 19% | 10% | 7% | 5% | 5% | 1% | 5% |
| HarrisX/Harris for Harvard CAPS | Feb. 25–26 | RV | — | 39% | 24% | 14% | 10% | ||||
| Echelon Insights | Feb. 19–23 | 498 LV | ±4.4 | 18% | 24% | 8% | 9% | 4% | 4% | 1% | 3% |
| Emerson College | Feb. 21–22 | 438 LV | ±4.7 | 12.8% | 19.6% | 15.7% | 9.1% | 7% | |||
| Bowling Green State University/YouGov | Feb. 13–18 | 556 RV | ±4.2 | 18% | 21% | 11% | 11% | 3% | 7% | 2% | |
| Manhattan Institute | Feb. 6–15 | 1,494 LV | ±2.5 | 33% | 28% | 13% | 16% | ||||
| YouGov for Yahoo News | Feb. 9–12 | 511 RV | ±4.3 | 18% | 19% | 13% | 12% | 9% | 3% | ||
| Focaldata | Feb. 10 | 441 LV | ±4.7 | 37% | 20% | 6% | 10% | 6% | 5% | 1% | |
| TIPP Insights for Issues & Insights | Jan. 27–29 | 527 RV | ±4.3 | 38% | 13% | 5% | 2% | 4% | 3% | 2% | |
| HarrisX/Harris Poll for Harvard CAPS | Jan. 28–29 | 2,000 RV | ±2.2 | 39% | 30% | 12% | 9% | ||||
| McLaughlin & Associates | Jan. 21–27 | 455 LV | ±4.6 | 27% | 14% | 8% | 7% | 4% | 3% | ||
| Focaldata | Jan. 23–26 | 735 LV | ±3.6 | 40% | 22% | 9% | 9% | 4% | 6% | 1% | |
| Echelon Insights | Jan. 22–26 | 466 LV | ±4.5 | 21% | 27% | 8% | 9% | 3% | 4% | 3% | |
| Big Data Poll for Public Polling Project | Jan. 22–24 | 1,346 LV | ±2.7 | 31.4% | 22.2% | 11.7% | 6.4% | 6.1% | |||
| YouGov | Jan. 9–14 | 1,024 A | ±3.1 | 20% | 17% | 8% | 9% | 2% | 7% | 3% | |
| Zogby Analytics | Jan. 2–7 | 374 LV | ±5.1 | 30% | 21% | 8% | 11% | 6% | 7% | ||
| McLaughlin & Associates | Dec. 12–19 | 1,000 LV | ±3.1 | 27% | 17% | 8% | 6% | 5% | 2% | ||
| J.L. Partners for DailyMail.com | Dec. 17–19 | 383 LV | ±5.0 | 30% | 21% | 7% | 3% | 4% | 4% | 1% | 3% |
| AtlasIntel | Dec. 15–19 | 2,315 A | ±2.0 | 7.8% | 35.4% | 14.5% | 16% | 6.1% | 2.5% | ||
| Echelon Insights | Dec. 11–15 | 498 LV | ±4.4 | 22% | 23% | 11% | 6% | 4% | 2% | 4% | |
| Big Data Poll for Public Polling Project | Dec. 10–12 | 1,331 LV | ±2.7 | 31% | 20% | 10% | 6% | 6% | |||
| McLaughlin & Associates | Nov. 17–24 | 1,000 LV | ±3.1 | 29% | 20% | 8% | 6% | 4% | 3% | ||
| Echelon Insights | Nov. 13–17 | 484 LV | ±4.5 | 13% | 23% | 13% | 9% | 4% | 4% | ||
| Yale Youth Poll | Oct. 29–Nov. 11 | 3,426 RV | ±1.7 | 18% | 25% | 14% | 16% | 4% | |||
| YouGov | Nov. 6–9 | 1,002 A | ±3.1 | 21% | 19% | 10% | 6% | 3% | 1% | 4% | |
| Morning Consult | Nov. 7–9 | 984 RV | ±3.1 | 29% | 20% | 8% | 7% | ||||
| Emerson College | Nov. 3–4 | 417 RV | ±4.8 | 10.3% | 24.5% | 8.6% | 2.8% | 2.6% | 1.2% | ||
| Overton Insights/Targoz Market Research | Oct. 27–29 | 396 RV | ±4.9 | 35% | 23% | 7% | 7% | 5% | 5% | ||
| McLaughlin & Associates | Oct. 21–27 | 437 LV | ±4.7 | 25% | 22% | 6% | 4% | 6% | 3% | ||
| Echelon Insights | Oct. 16–20 | 512 LV | ±4.3 | 24% | 15% | 10% | 4% | 5% | 5% | ||
| Noble Predictive Insights for The Center Square | Oct. 2–6 | 1,147 RV | ±2.9 | 33% | 21% | 7% | 8% | 4% | |||
| Leger | Sept. 26–29 | 341 A | ±5.3 | 24% | 19% | 9% | 9% | 8% | |||
| McLaughlin & Associates | Sept. 17–22 | 429 LV | ±4.7 | 21% | 22% | 7% | 5% | 4% | 4% | ||
| Echelon Insights | Sept. 18–22 | 1,071 LV | ±3.0 | 23% | 17% | 7% | 7% | 6% | 6% | ||
| AtlasIntel | Sept. 12–16 | 1,066 A | ±3.0 | 20.5% | 37.4% | 12.1% | 10.8% | 2.1% | 2.9% | ||
| YouGov | Sept. 5–8 | 519 A | ±4.3 | 19% | 23% | 6% | 8% | 2% | 1% | ||
| YouGov for Yahoo News | Aug. 29–Sept. 2 | 250 RV | ±6.2 | 19% | 21% | 10% | 12% | 4% | |||
| Leger | Aug. 29–31 | 328 RV | ±5.4 | 30% | 24% | 8% | 10% | 2% | |||
| McLaughlin & Associates | Aug. 21–26 | 434 LV | ±4.7 | 27% | 18% | 9% | 4% | 3% | 3% | ||
| Emerson College | Aug. 25–26 | 387 RV | ±5.0 | 11.4% | 25.1% | 16% | 4.1% | 5.3% | 2.3% | ||
| Morning Consult | Aug. 22–24 | RV | — | 29% | 19% | 9% | 6% | 4% | |||
| Echelon Insights | Aug. 14–18 | 522 LV | ±4.3 | 26% | 13% | 11% | 6% | 3% | 5% | ||
| YouGov for The Times of London | July 18–21 | 622 RV | ±3.9 | 21% | 11% | 14% | 10% | 3% | 1% | 4% | |
| McLaughlin & Associates | July 9–14 | 444 LV | ±4.7 | 25% | 9% | 8% | 9% | 4% | 4% | ||
| Echelon Insights | July 10–14 | 505 LV | ±4.4 | 26% | 10% | 11% | 6% | 4% | 7% | ||
| Targoz Market Research for Overton Insights | June 23–26 | 396 RV | ±4.9 | 30% | 8% | 10% | 7% | 3% | 7% | ||
| Emerson College | June 24–25 | 404 LV | ±4.9 | 12.5% | 11.7% | 15.6% | 7.1% | 7% | 3.4% | ||
| Morning Consult | June 13–15 | 1,000 RV | ±3.1 | 34% | 11% | 7% | 7% | 2% | 0% | 3% | |
| McLaughlin & Associates | June 10–15 | 434 LV | ±4.7 | 30% | 8% | 10% | 7% | 3% | 7% | ||
| AtlasIntel | May 21–27 | A | — | 16.6% | 7.1% | 31.5% | 19.4% | 4.8% | 10.4% | ||
| McLaughlin & Associates | May 21–26 | 439 LV | ±4.7 | 29% | 4% | 10% | 9% | 6% | 7% | ||
| J.L. Partners | May 13–14 | RV | — | 30% | 7% | 8% | 6% | 7% | |||
| Echelon Insights | May 8–12 | 471 LV | ±4.5 | 32% | 5% | 10% | 8% | 2% | 6% | ||
| McLaughlin & Associates | April 22–29 | 442 LV | ±4.7 | 30% | 8% | 6% | 8% | 4% | 7% | ||
| YouGov for The Times of London | April 21–23 | 440 RV | ±4.7 | 28% | 8% | 9% | 7% | 5% | 1% | 8% | |
| Quantus Insights R for TrendingPolitics | April 21–23 | 700 RV | ±3.7 | 30% | 7% | 13% | 14% | 5% | 13% | ||
| Echelon Insights | April 10–14 | 449 LV | ±4.6 | 28% | 4% | 7% | 7% | 3% | 11% | ||
| Data for Progress | April 9–14 | 745 LV | ±3.6 | 18% | 8% | 14% | 12% | 5% | 12% | ||
| AtlasIntel | April 10–14 | A | — | 24.1% | 6.8% | 27.7% | 15.9% | 8.7% | |||
| Yale University Institution for Social and Policy Studies | April 1–3 | RV | — | 27.5% | 6.4% | 14% | 21.3% | 4.6% | |||
| YouGov for The Economist | March 30–April 1 | 691 A | ±3.7 | 25% | 7% | 10% | 8% | 4% | 1% | ||
| Targoz Market Research for Overton Insights | March 24–28 | 512 RV | ±4.3 | 48% | 10% | 15% | 9% | ||||
| Morning Consult | March 14–16 | RV | — | 36% | 5% | 10% | 5% | 4% | 3% | ||
| Echelon Insights | March 10–13 | 457 LV | ±4.6 | 33% | 7% | 10% | 7% | 2% | 2% | ||
| McLaughlin & Associates | Feb. 11–18 | 418 LV | ±4.8 | 36% | 4% | 8% | 3% | 3% | 3% | ||
| Echelon Insights | Feb. 10–13 | 443 LV | ±4.7 | 36% | 6% | 10% | 5% | 3% | 2% | ||
| J.L. Partners for DailyMail.com | Feb. 2–3 | 500 RV | ±4.4 | 30% | 8% | 8% | 5% | 5% | 3% | ||
| McLaughlin & Associates | Jan. 22–27 | 414 LV | ±4.8 | 35% | 7% | 9% | 6% | 3% | 2% | ||
| McLaughlin & Associates | Dec. 11–16 | 428 LV | ±4.7 | 35% | 7% | 12% | 3% | 5% | 2% | ||
| Emerson College | Nov. 20–22 | 400 A | ±4.9 | 36.5% | 6.6% | 3.5% | 0.9% | 2.6% | 0.4% | ||
| Echelon Insights | Nov. 14–18 | 465 LV | ±4.5 | 41% | 8% | 6% | 4% | 7% | 2% | ||
| Morning Consult | Nov. 15–17 | 1,012 A | ±3.1 | 43% | 8% | 9% | 4% | 5% | 2% |
Average of 15 national polls · latest ended Sept. 15
| Poll | Date | Sample | MoE | Vance | Rubio | Jr. | DeSantis | Jr. | Haley | Cruz | Abbott |
|---|---|---|---|---|---|---|---|---|---|---|---|
| COYNTOSS average | As of Nov. 7 | 38.3% | 17.3% | 13.5% | 7.6% | 5.6% | 4.6% | 3.5% | 2.6% | ||
| Big Data Poll for Public Polling Project | Sept. 13–15 | 1,110 LV | ±2.9 | 38.3% | 15.7% | 8.4% | 6.3% | 5.8% | 3.9% | ||
| Noble Predictive Insights for The Center Square | Aug. 12–16 | 930 RV | ±3.2 | 41% | 18% | 6% | 3% | 4% | 3% | ||
| Echelon Insights | June 11–14 | 466 LV | ±4.5 | 42% | 15% | 7% | 6% | 3% | 2% | ||
| Noble Predictive Insights for The Center Square | June 1–4 | 1,064 RV | ±3.0 | 36% | 17% | 7% | 3% | 5% | 2% | ||
| Focaldata for Financial Times | May 29–June 1 | 632 LV | ±3.9 | 38% | 18% | 10% | 9% | 5% | 3% | ||
| HarrisX/Harris for Harvard CAPS | May 29–31 | RV | — | 45% | 21% | 21% | |||||
| Focaldata for Financial Times | May 29 | 667 A | ±3.8 | 37% | 18% | 10% | 9% | 5% | 3% | ||
| TIPP Insights for Issues & Insights | May 26–28 | 561 RV | ±4.1 | 29% | 12% | 19% | 6% | 4% | 2% | 3% | 1% |
| Big Data Poll for Public Polling Project | May 24–27 | 1,148 LV | ±2.9 | 37% | 16% | 7% | 6% | 4% | 3% | ||
| Emerson College | May 24–25 | 432 LV | ±4.7 | 35.5% | 34.6% | 5.4% | 3.1% | 4.6% | 0.7% | ||
| Overton Insights | May 16–20 | LV | — | 39% | 32% | 0% | 9% | 4% | 0% | ||
| J.L. Partners for DailyMail.com | May 15–19 | 496 LV | ±4.4 | 47% | 18% | 9% | 3% | 4% | |||
| McLaughlin & Associates | May 12–18 | 431 LV | ±4.7 | 32% | 15% | 13% | 6% | 5% | 2% | ||
| Echelon Insights | May 14–18 | 418 LV | ±4.8 | 36% | 17% | 6% | 12% | 2% | 2% | ||
| Lord Ashcroft Polls | April 28–May 17 | 3,804 A | ±1.6 | 32% | 13% | 22% | 7% | 5% | 3% | ||
| AtlasIntel | May 4–7 | A | — | 30% | 45% | 0% | 11% | 1% | |||
| Focaldata for Financial Times | May 1–5 | 1,291 RV | ±2.7 | 40% | 13.9% | 15.2% | 7.5% | 5.3% | 2.8% | ||
| HarrisX/Harris for Harvard CAPS | April 23–26 | RV | — | 48% | 16% | 18% | 9% | ||||
| Verasight | April 21–23 | 802 A | ±3.5 | 37% | 16% | 13% | 7% | 4% | 2% | ||
| Echelon Insights | April 17–20 | 467 LV | ±4.5 | 42% | 14% | 10% | 8% | 2% | 1% | ||
| McLaughlin & Associates | April 8–15 | 422 LV | ±4.8 | 35% | 13% | 15% | 7% | 3% | 2% | ||
| YouGov | April 8–13 | 825 A | ±3.4 | 36% | 13% | 13% | 6% | 2% | 1% | 2% | |
| HarrisX/Harris for Harvard CAPS | March 25–26 | RV | — | 42% | 17% | 20% | 10% | ||||
| Yale Youth Poll | March 9–23 | 1,224 RV | ±2.8 | 43% | 17% | 9% | 6% | 3% | 3% | 2% | 1% |
| Echelon Insights | March 12–16 | 474 LV | ±4.5 | 40% | 16% | 9% | 5% | 3% | 5% | 1% | |
| Focaldata | March 6–10 | 560 RV | ±4.1 | 47% | 15% | 18% | 10% | 4% | 3% | ||
| McLaughlin & Associates | March 4–9 | 440 LV | ±4.7 | 36% | 10% | 15% | 9% | 3% | 1% | ||
| J.L. Partners for DailyMail.com | March 2–3 | RV | — | 53% | 14% | 7% | 3% | 3% | |||
| The Public Sentiment Institute | Feb. 28 | 104 LV | ±9.6 | 45% | 19% | 5% | 3% | 5% | 1% | ||
| McLaughlin & Associates | Jan. 21–Feb. 27 | 442 LV | ±4.7 | 42% | 8% | 16% | 7% | 4% | 3% | ||
| HarrisX/Harris for Harvard CAPS | Feb. 25–26 | RV | — | 43% | 14% | 27% | 8% | ||||
| Echelon Insights | Feb. 19–23 | 436 LV | ±4.7 | 37% | 11% | 14% | 8% | 3% | 3% | 3% | |
| Emerson College | Feb. 21–22 | 454 LV | ±4.6 | 51.5% | 19.6% | 6.1% | 3.8% | 2.7% | 1.4% | ||
| Bowling Green State University/YouGov | Feb. 13–18 | 463 RV | ±4.6 | 51% | 15% | 8% | 9% | 2% | 2% | 2% | |
| Focaldata | Feb. 10 | 406 LV | ±4.9 | 49% | 8% | 13% | 7% | 6% | 3% | 2% | |
| TIPP Insights for Issues & Insights | Jan. 27–29 | 478 RV | ±4.5 | 43% | 5% | 18% | 5% | 2% | 2% | 2% | |
| HarrisX/Harris Poll for Harvard CAPS | Jan. 28–29 | 2,000 RV | ±2.2 | 53% | 17% | 21% | |||||
| Focaldata | Jan. 23–26 | 726 LV | ±3.6 | 52% | 8% | 21% | 8% | 7% | 4% | ||
| Echelon Insights | Jan. 22–26 | 466 LV | ±4.5 | 40% | 6% | 12% | 7% | 4% | 5% | 1% | |
| Big Data Poll for Public Polling Project | Jan. 22–24 | 1,306 LV | ±2.7 | 46% | 6.8% | 9.5% | 6.8% | 5.4% | 3.9% | ||
| YouGov | Jan. 9–14 | 743 A | ±3.6 | 41% | 7% | 11% | 8% | 1% | 1% | 2% | |
| Zogby Analytics | Jan. 2–7 | 340 LV | ±5.3 | 58% | 8% | 9% | 3% | ||||
| McLaughlin & Associates | Dec. 12–19 | 1,000 LV | ±3.1 | 34% | 6% | 26% | 7% | 3% | 1% | ||
| AtlasIntel | Dec. 15–19 | 2,315 A | ±2.0 | 46.7% | 22.6% | 1.6% | 13.4% | 1% | |||
| Echelon Insights | Dec. 11–15 | 426 LV | ±4.7 | 45% | 4% | 12% | 9% | 3% | 4% | 3% | |
| Big Data Poll for Public Polling Project | Dec. 10–12 | 1,337 LV | ±2.7 | 45% | 7% | 8% | 6% | 5% | 5% | ||
| McLaughlin & Associates | Nov. 17–24 | 1,000 LV | ±3.1 | 34% | 4% | 24% | 6% | 6% | 2% | ||
| Echelon Insights | Nov. 13–17 | 472 LV | ±4.5 | 47% | 8% | 10% | 5% | 5% | 2% | ||
| Yale Youth Poll | Oct. 29–Nov. 11 | 3,426 RV | ±1.7 | 51% | 5% | 8% | 6% | 3% | 5% | ||
| YouGov | Nov. 6–9 | 785 A | ±3.5 | 42% | 5% | 13% | 7% | 3% | 1% | 4% | |
| Morning Consult | Nov. 7–9 | 936 RV | ±3.2 | 42% | 3% | 19% | 7% | 3% | 5% | ||
| Emerson College | Nov. 3–4 | 420 RV | ±4.8 | 22.5% | 2.6% | 0.7% | |||||
| Overton Insights/Targoz Market Research | Oct. 27–29 | 444 RV | ±4.7 | 34% | 7% | 22% | 12% | 8% | 5% | ||
| Echelon Insights | Oct. 16–20 | 400 LV | ±4.9 | 6% | 10% | 5% | 6% | 2% | |||
| Noble Predictive Insights for The Center Square | Oct. 2–6 | 1,156 RV | ±2.9 | 4% | 25% | 6% | 3% | 3% | |||
| Leger | Sept. 26–29 | 294 A | ±5.7 | 6% | 6% | ||||||
| McLaughlin & Associates | Sept. 17–22 | 470 LV | ±4.5 | 5% | 8% | 3% | 0% | ||||
| AtlasIntel | Sept. 12–16 | 1,066 A | ±3.0 | 12.2% | 1.2% | 16.3% | |||||
| YouGov for The Times of London | April 21–23 | 365 RV | ±5.1 | 2% | 5% | 7% | 4% | 3% | 2% | ||
| Echelon Insights | April 10–14 | 476 LV | ±4.5 | 4% | 9% | 7% | 4% | 1% | |||
| AtlasIntel | April 10–14 | A | — | 8.6% | 8.8% | ||||||
| Yale Youth Poll | April 1–3 | RV | — | 2.8% | 7.5% | 8.7% | 3.5% | 3.2% | |||
| YouGov for The Economist | March 30–April 1 | 633 A | ±3.9 | 4% | 11% | 8% | 2% | 3% | 2% | ||
| Targoz Market Research for Overton Insights | March 24–28 | 536 RV | ±4.2 | 6% | 31% | 13% | |||||
| Echelon Insights | March 10–13 | 450 LV | ±4.6 | 4% | 7% | 7% | 7% | 5% | |||
| McLaughlin & Associates | Feb. 11–18 | 468 LV | ±4.5 | 3% | 17% | 6% | 3% | 1% | |||
| Echelon Insights | Feb. 10–13 | 472 LV | ±4.5 | 4% | 10% | 8% | 4% | ||||
| J.L. Partners | Feb. 2–3 | 1,000 RV | ±3.1 | 2% | 13% | 6% | 6% | ||||
| McLaughlin & Associates | Jan. 22–27 | 453 LV | ±4.6 | 3% | 21% | 8% | 2% | 2% | |||
| McLaughlin & Associates | Dec. 11–16 | 463 LV | ±4.6 | 2% | 21% | 9% | 4% | 1% | |||
| Morning Consult | Dec. 6–8 | 994 RV | ±3.1 | 1% | 30% | 9% | 5% | 6% | 1% | ||
| Emerson College | Nov. 20–22 | 420 A | ±4.8 | 0.8% | 22.8% | 5.2% | 1.5% | 1.7% | 0.5% | ||
| Echelon Insights | Nov. 14–18 | 475 LV | ±4.5 | 5% | 8% | 9% | 5% |
Average of national polls from the past year. Single-poll pairings are shown when both candidates are in their party’s primary average.
Ocasio-CortezAOC41.2Newsom43.5Harris48.2Ocasio-CortezAOC40.3Newsom43.7Harris44.0Buttigieg41.3Ossoff49.0Ossoff47.0| Poll | Date | Sample | MoE | Ocasio-Cortez | Vance | Margin |
|---|---|---|---|---|---|---|
| COYNTOSS average | Past year | 41.2% | 43.7% | R+2.5 | ||
| McLaughlin & Associates | Oct. 30–Nov. 5 | 1,000 LV | ±3.1 | 39% | 49% | R+10.0 |
| The Bulwark/Pablo Torre Finds Out/YouGov | Oct. 10–14 | 1,417 A | ±2.6 | 40% | 38% | D+2.0 |
| UMass Lowell/YouGov | Oct. 2–4 | 1,000 LV | ±3.1 | 45% | 42% | D+3.0 |
| Quantus Insights | Aug. 26–28 | 1,200 LV | ±2.8 | 42% | 45% | R+3.0 |
| Emerson College | Aug. 16–17 | 1,000 LV | ±3.1 | 44% | 46% | R+2.0 |
| Zogby | July 1–4 | 1,003 LV | ±3.1 | 38% | 45% | R+7.0 |
| UMass Lowell | March 26–30 | 1,000 RV | ±3.1 | 33% | 36% | R+3.0 |
| Focaldata | March 6–10 | 1,782 A | ±2.3 | 43% | 40% | D+3.0 |
| The Argument/Verasight | Dec. 5–11 | 1,521 RV | ±2.5 | 51% | 49% | D+2.0 |
| Poll | Date | Sample | MoE | Newsom | Vance | Margin |
|---|---|---|---|---|---|---|
| COYNTOSS average | Past year | 43.5% | 40.0% | D+3.5 | ||
| The Bulwark/Pablo Torre Finds Out/YouGov | Oct. 10–14 | 1,417 A | ±2.6 | 41% | 36% | D+5.0 |
| UMass Lowell/YouGov | Oct. 2–4 | 1,000 LV | ±3.1 | 46% | 42% | D+4.0 |
| Emerson College | Aug. 16–17 | 1,000 LV | ±3.1 | 49% | 44% | D+5.0 |
| Zogby | July 1–4 | 1,003 LV | ±3.1 | 38% | 45% | R+7.0 |
| Overton Insights | May 16–20 | 1,377 V | ±2.6 | 44% | 39% | D+5.0 |
| UMass Lowell | March 26–30 | 1,000 RV | ±3.1 | 33% | 36% | R+3.0 |
| Zogby | Jan. 1–7 | 891 LV | ±3.3 | 41% | 44.6% | R+3.6 |
| The Argument/Verasight | Nov. 10–17 | 1,508 RV | ±2.5 | 53.6% | 46.4% | D+7.2 |
| Morning Consult | Nov. 14–16 | 2,201 RV | ±2.1 | 41% | 42% | R+1.0 |
| Poll | Date | Sample | MoE | Harris | Vance | Margin |
|---|---|---|---|---|---|---|
| COYNTOSS average | Past year | 48.2% | 43.3% | D+4.9 | ||
| Emerson College | Aug. 16–17 | 1,000 LV | ±3.1 | 49% | 45% | D+4.0 |
| Zogby | July 1–4 | 1,003 LV | ±3.1 | 48% | 43% | D+5.0 |
| TPSI | May 21 | 893 LV | ±3.3 | 47% | 39% | D+8.0 |
| Zogby | Jan. 1–7 | 891 LV | ±3.3 | 48.5% | 42.1% | D+6.4 |
| Morning Consult | Nov. 14–16 | 2,201 RV | ±2.1 | 43% | 42% | D+1.0 |
| Poll | Date | Sample | MoE | Ocasio-Cortez | Rubio | Margin |
|---|---|---|---|---|---|---|
| COYNTOSS average | Past year | 40.3% | 45.6% | R+5.3 | ||
| McLaughlin & Associates | Oct. 30–Nov. 5 | 1,000 LV | ±3.1 | 38% | 48% | R+10.0 |
| UMass/YouGov | Oct. 2–4 | 1,000 LV | ±3.1 | 43% | 43% | Even |
| Emerson College | Aug. 16–17 | 1,000 LV | ±3.1 | 43% | 48% | R+5.0 |
| Zogby | July 1–4 | 1,003 LV | ±3.1 | 38% | 39% | R+1.0 |
| Poll | Date | Sample | MoE | Newsom | Rubio | Margin |
|---|---|---|---|---|---|---|
| COYNTOSS average | Past year | 43.7% | 42.8% | D+0.9 | ||
| UMass Lowell/YouGov | Oct. 2–4 | 1,000 LV | ±3.1 | 44% | 42% | D+2.0 |
| Emerson College | Aug. 16–17 | 1,000 LV | ±3.1 | 48% | 46% | D+2.0 |
| Zogby | July 1–4 | 1,003 LV | ±3.1 | 36% | 40% | R+4.0 |
| Morning Consult | Nov. 14–16 | 2,201 RV | ±2.1 | 41% | 39% | D+2.0 |
| Poll | Date | Sample | MoE | Harris | Rubio | Margin |
|---|---|---|---|---|---|---|
| COYNTOSS average | Past year | 44.0% | 45.2% | R+1.2 | ||
| Emerson College | Aug. 16–17 | 1,000 LV | ±3.1 | 43% | 48% | R+5.0 |
| Zogby | July 1–4 | 1,003 LV | ±3.1 | 46% | 41% | D+5.0 |
| Morning Consult | Nov. 14–16 | 2,201 RV | ±2.1 | 42% | 40% | D+2.0 |
| Poll | Date | Sample | MoE | Buttigieg | Vance | Margin |
|---|---|---|---|---|---|---|
| COYNTOSS average | Past year | 41.3% | 38.4% | D+2.9 | ||
| The Bulwark/Pablo Torre Finds Out/YouGov | Oct. 10–14 | 1,417 A | ±2.6 | 38% | 36% | D+2.0 |
| Emerson College | Aug. 16–17 | 1,000 LV | ±3.1 | 49% | 44% | D+5.0 |
| Poll | Date | Sample | MoE | Ossoff | Vance | Margin |
|---|---|---|---|---|---|---|
| COYNTOSS average | Past year | 49.0% | 44.0% | D+5.0 | ||
| Emerson College | Aug. 16–17 | 1,000 LV | ±3.1 | 49% | 44% | D+5.0 |
| Poll | Date | Sample | MoE | Ossoff | Rubio | Margin |
|---|---|---|---|---|---|---|
| COYNTOSS average | Past year | 47.0% | 44.0% | D+3.0 | ||
| Emerson College | Aug. 16–17 | 1,000 LV | ±3.1 | 47% | 44% | D+3.0 |